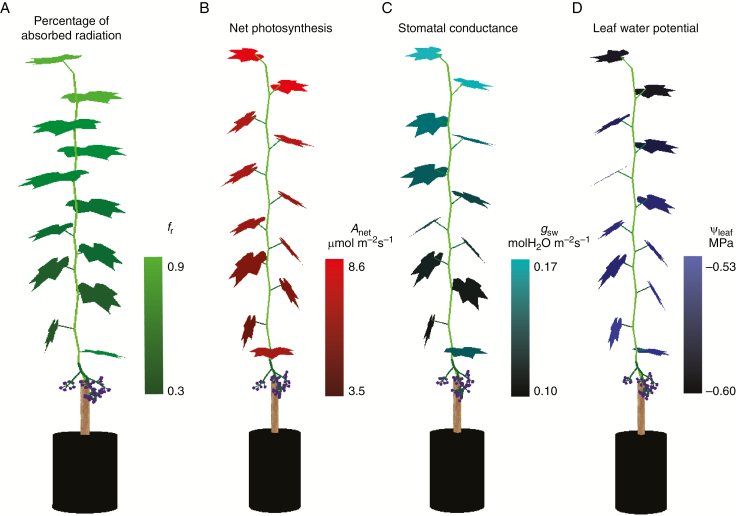
Fig. 1.
Illustration of the simulated percentage of absorbed radiation (A), net photosynthesis (B), stomatal conductance (C) and leaf water potential of each leaf (D). The environmental conditions for the simulation were set as: Ta 25 °C, CO2 400 ppm, −0.3 MPa, Ra 2000 µmol m−2 s−1 (PAR 1100 µmol m−2s−1), VPD 1 kPa. The comparison between simulated canopy leaf temperature and canopy thermal picture (FLIR T450sc, FLIR Systems AB, Frankfurt am Main, Germany) is presented in Fig. S1. A movie showing the diurnal dynamics of leaf transpiration within a soil drying cycle is presented in Video S1.

