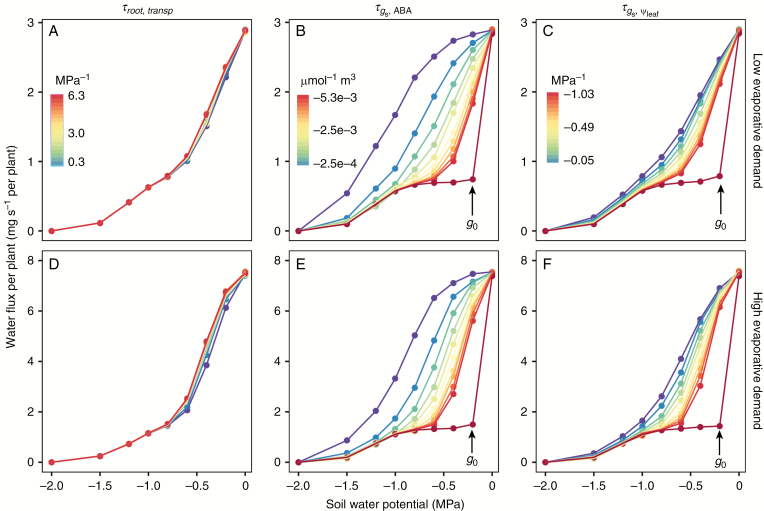
Fig. 7.
Response of plant water flux at different soil water potentials to changes in (A, D), (B, E) and (C, F). Row 1 represents low evaporative conditions (2.4 mg per plant s−1), and row 2 represents high evaporative conditions (6 mg per plant s−1). The colour gradient from purple to red represents increasing absolute value of the tested parameters, 10–210 % of the default value (median value in the legend). One extra simulation (dark red points and lines), 10 times the default value was added for both and

