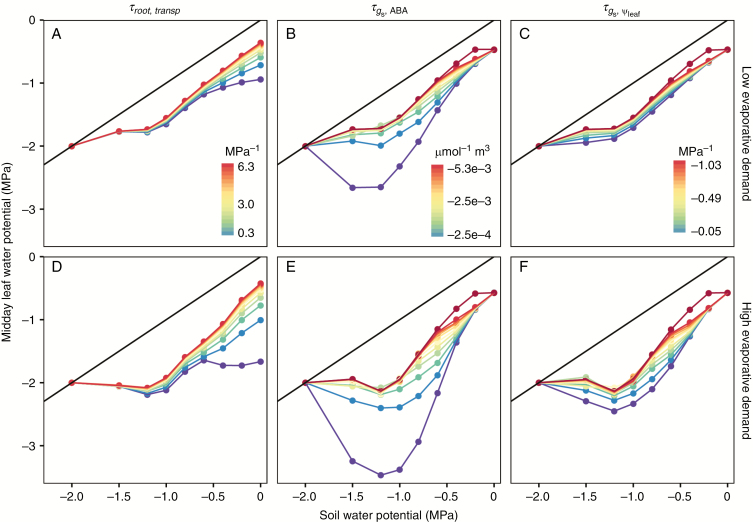
Fig. 8.
Response of midday leaf water potential at different soil water potentials to changes in and Row 1 represents low evaporative conditions (2.4 mg per plant s−1), and row 2 represents high evaporative conditions (6 mg per plant s−1). The colour gradient from purple to red represents increasing absolute value of the tested parameter, 10–210 % of the default value. One extra simulation (dark red points and lines), 10 times the default value was added for both and Black lines represent the 1: 1 lines.

