Figure 3.
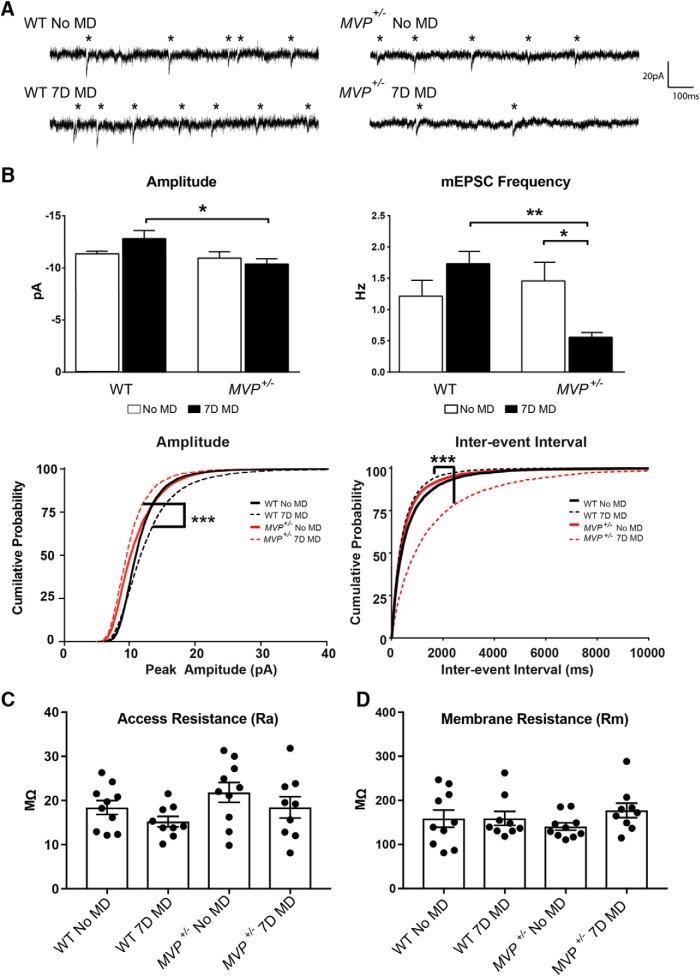
MVP+/− mice show impaired homeostatic scaling of AMPAR-mediated mEPSCs after 7 d MD. A, Representative traces of AMPAR-mediated mEPSCs recorded in V1 slices from WT and MVP+/− mice, in No MD and 7 d MD conditions. Each asterisk shows an individual mEPSC. B, Left, Top, Average peak amplitudes for mEPSCs. Bottom, Cumulative probabilities of mEPSC peak amplitudes. Right, Top, Average mEPSC frequencies. Bottom, Cumulative probabilities of mEPSC interevent intervals. WT No MD and 7 d MD, n = 10 (5) and 9 (4) cells (animals), respectively; MVP+/− No MD and 7 d MD, n = 10 (3) and 9 (3) cells (animals), respectively. C, Access resistance and (D) membrane resistance of the neurons examined. Averaged data are presented as mean ± SEM. *p < 0.05, **p < 0.01, ***p < 0.001.

