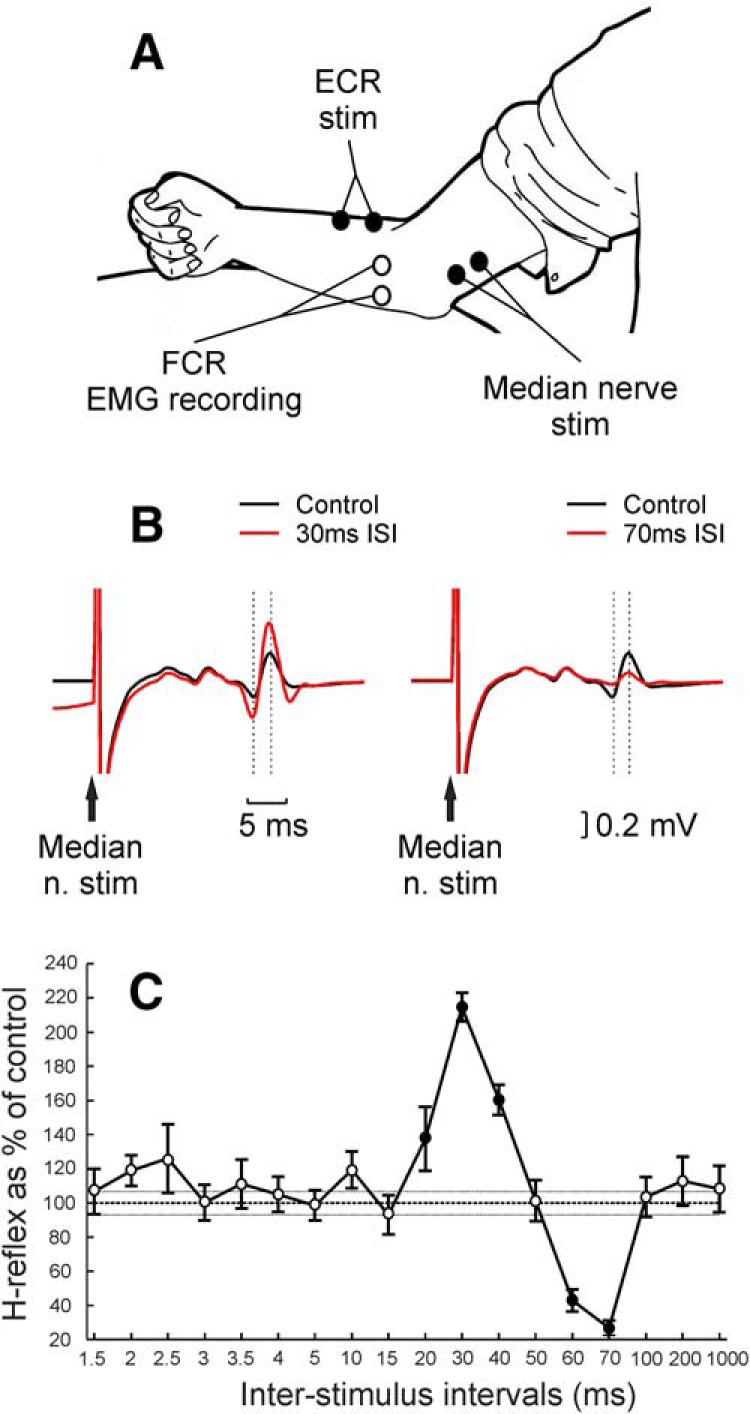
Figure 1.

Experimental setup and example of main result in a healthy human subject. A, Schematic representation of experimental setup. EMG recording electrodes were positioned over FCR muscle belly, and stimulating electrodes were positioned over the median nerve (to evoke FCR H-reflex) and over the ECR muscle belly. B, Example from one subject of the comparison between control (black) and conditioned (red) H-reflex at both 30 and 70 ms ISIs between median nerve stimulation (n. stim) and conditioning ECR electrical stimulation at 3× MT; traces are the average of 20 repetitions for control and 10 repetitions for conditioned H-reflex. Dashed lines indicate the times used to measure H-reflex amplitude. C, Example from the same subject of conditioning curve showing the H-reflex amplitude as a percentage of its control amplitude for 18 ISIs between median nerve and conditioning ECR electrical stimulation at 3× MT. Filled circles represent responses significantly different from control. Error bars represent the SE. Thin dashed horizontal lines indicate the SE of control H-reflex amplitude.
