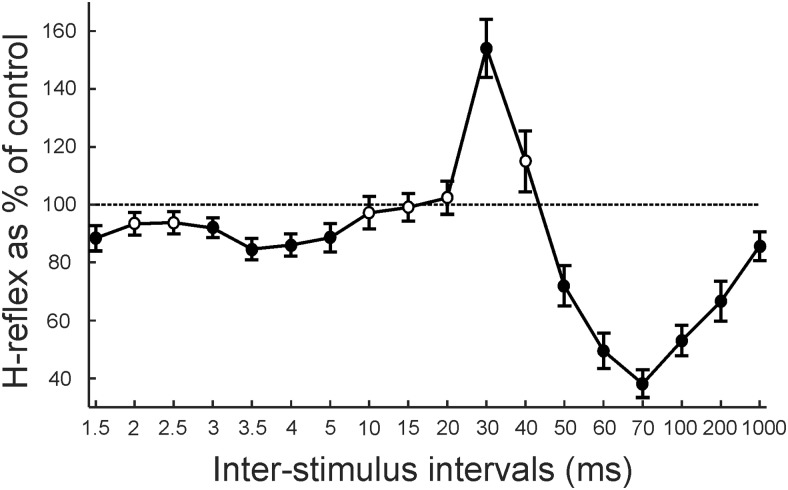
Figure 2.
Population-averaged data in healthy humans. Average from 17 subjects of H-reflex amplitude, shown as a percentage of its control amplitude, for 18 ISIs between median nerve and conditioning ECR electrical stimulation at 3× MT. Filled circles represent responses significantly different from control. Error bars represent the SE. For one subject, data from ISIs up to 5 ms, and for another subject up to 3 ms, were omitted from the average due to contamination by the stimulus artifact.

