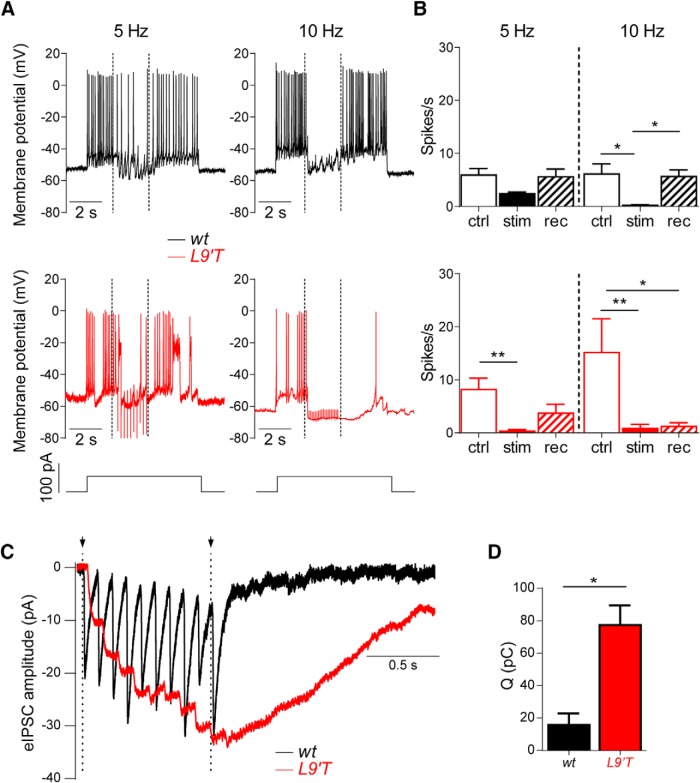
Figure 9.
Stimulation of the MOC efferent fibers causes a strong and persistent inhibition of Ca2+ action potentials in L9′T mice. A, Representative traces of action potential firing in one cell from a wt (top, black) and in one cell from a L9′T (bottom, red) mouse. Efferent stimulation at 5 and 10 Hz (dotted lines indicate the onset and the end of the stimulation period) caused hyperpolarization of the IHCs and diminished or suppressed firing. B, Bar graphs showing spike frequency in the IHCs at 5 and 10 Hz in both genotypes. Note that in L9′T mice, firing suppression is seen at 5 Hz and recovery after the end of the stimulation period is not complete. At 10 Hz action potentials are suppressed in both genotypes, however, in the L9′T mice, almost no recovery is observed after the stimulation period. ctrl, Control; stim, stimulation; rec, recovery. wt, n = 5 cells from three different animals; L9′T, n = 5 cells from four different mice. *p < 0.05, **p < 0.01; Kruskal–Wallis one-way ANOVA. C, Representative averaged traces of 20 individual synaptic responses in IHCs from both wt (black, n = 4 from 4 different mice) and L9′T mice (red, n = 3 from 3 different mice) upon a 10-pulse 10 Hz stimulation of the MOC fibers. Dotted lines indicate the beginning and the end of the stimulation period. D, Bar diagram depicting the total charge (Q) computed at the end of the protocol for both genotypes, at 10 Hz. *p < 0.05, Kolmogorov–Smirnov test.

