Figure 6.
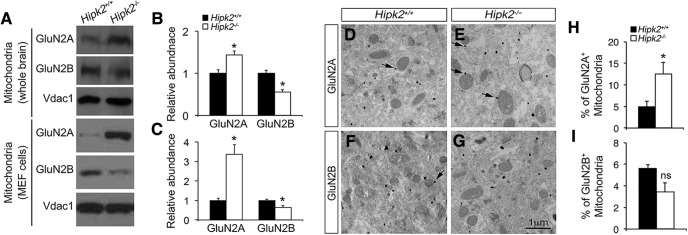
Altered GluN2A/GluN2B protein ratio in the mitochondria of Hipk2−/− mouse brain. A, Western blot results showed that the GluN2A protein level was significantly increased, whereas the GluN2B protein level was decreased, in the mitochondria isolated from the whole brain of 2-month-old Hipk2−/− mice (top) or from Hipk2−/− MEF cells (bottom). B, C, The relative signal intensity of GluN2A, GluN2B, and Vadc1 (a mitochondria-specific marker) protein bands in Hipk2+/+ and Hipk2−/− mouse brains and in Hipk2+/+ and Hipk2−/− MEF cells was quantified with National Institutes of Health ImageJ software, and reported in B and C, respectively. D–I, Immunogold electron microscopy results showed that the percentage of GluN2A+ mitochondria was indeed increased in Hipk2−/− neurons, which were mainly located on the outer membrane of the mitochondria. Arrows indicate the GluN2A- or GluN2B-positive mitochondria. Data are mean ± SEM from at least three independent experiments. *p < 0.05 (ANOVA). Not significant: p > 0.05.

