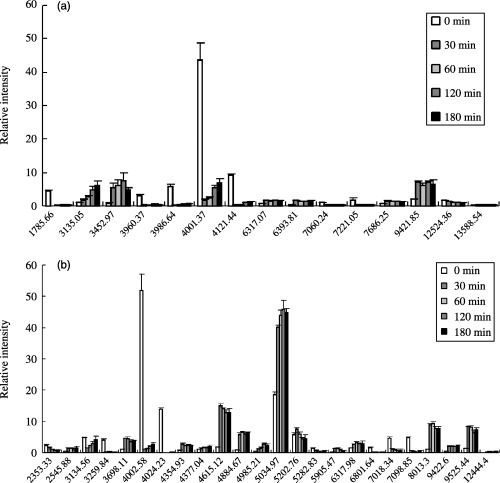
Figure 10.

Relative intensity of significant phosphopeptides detected on 8, 9. (a) Shows relative intensity of significant peaks detected on Figure 8. (b) Shows relative intensity of significant peaks detected on Figure 9. Vertical axis indicates relative density. Cross axis indicates molecular mass.
