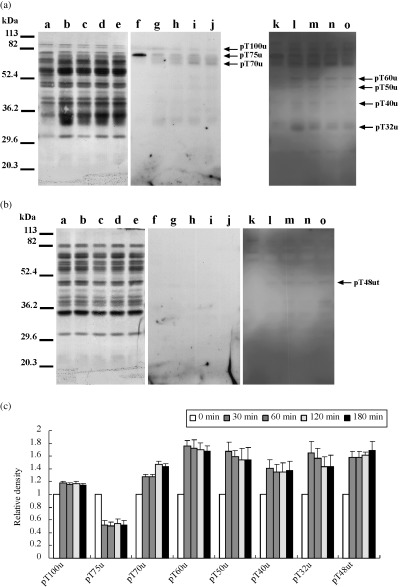
Figure 6.

Protein threonine phosphorylation during hyperactivation. (a) Western blotting of the urea extracts. (b) Western blotting of the urea‐thiourea extracts. Lanes a–e and f–o showed Coomassie Brilliant Blue stain of membrane and enhanced chemiluminescence, respectively. Exposure time of lanes f–j and lanes k–o was 5 min and 15 min, respectively. Lanes a, f and k, lanes b, g and l, lanes c, h and m, lanes d, i and n, and lanes e, j and o showed 0 min, 30 min, 60 min, 120 min and 180 min, respectively. Arrows show protein phosphorylations detected as a significant reaction on statistical analysis by one‐factor anova. Seven phosphoproteins detected on (a) were designated as pT100u, pT75u, pT70u, pT60u, pT50u, pT40u and pT32u. One phosphoprotein detected on (b) was designated as pT48ut. Numbers of left side show molecular markers. Experiment number was five. (c) Relative density of significant phosphorylations detected on (a) and (b). When reactivities of 0 min were taken, reactivities of each incubation times are shown.
