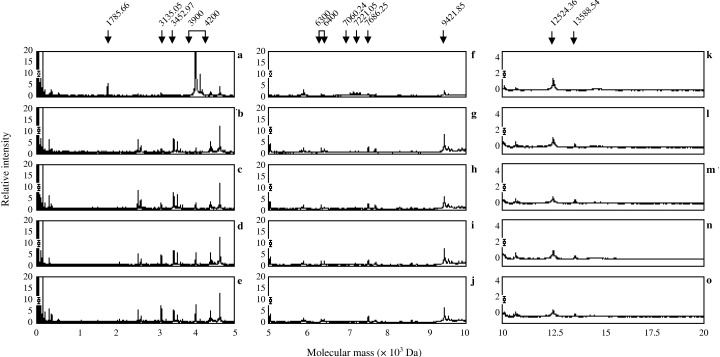
Figure 8.

Detection of phosphopeptides by IMAC‐Ga(III) from the urea extracts. (a–e) Show mass spectrogram mass range from 0 Da to 5000 Da (f–j), show mass spectrogram mass range from 5000 Da to 10 000 Da (k–o), show mass spectrogram mass range from 10000 Da to 20000 Da and (a, f and k) show mass spectrogram of 0 min. (b, g and l) Show mass spectrogram of incubation at 30 min. (c, h and m) Show mass spectrogram of incubation at 60 min. (d, i and n) Show mass spectrogram of incubation at 120 min. (e, j and o) Show mass spectrogram of incubation at 180 min. Arrows indicate significant peaks.
