Fig. 4.

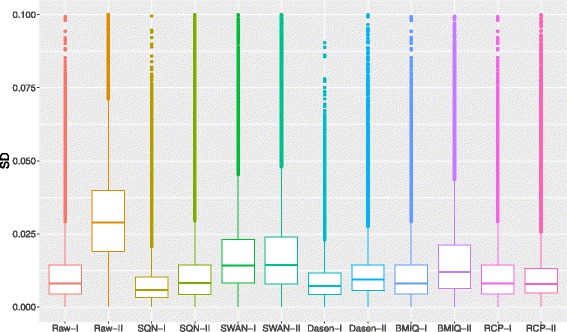
Box plot of standard deviation across replicates. The standard deviation between replicates after normalization shows that SQN, Dasen and RCP make the normalized β-values of replicates more similar than other two methods

Box plot of standard deviation across replicates. The standard deviation between replicates after normalization shows that SQN, Dasen and RCP make the normalized β-values of replicates more similar than other two methods