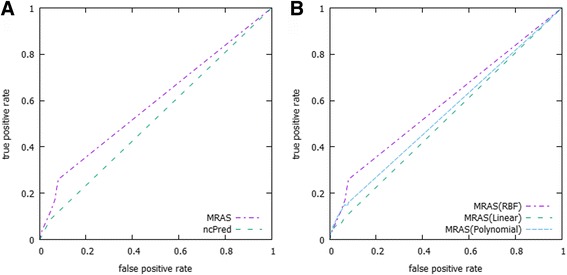
Fig. 5.

Comparison between the proposed method (MRAS) and ncPred. a shows an ROC curves comparison between the proposed method (MRAS) and ncPred with evaluation of the Chen et al. dataset. The ROC curves were drawn up based on the average results of the simulation, and repeated to ensure reliable estimates as described in the evaluation method procedure. The results also convey that the proposed method produced a higher true positive rate, which demonstrates its superior performance over its competitor. b shows the results of the proposed method using different kernel functions
