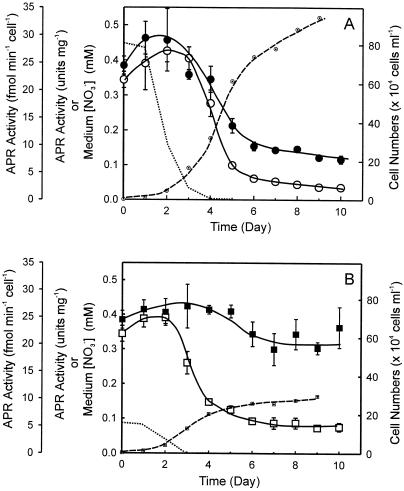
Figure 5.
APR activity from Tetraselmis sp. cultures grown with abundant N supply (A) and limited N supply (B). Dotted lines indicate the nitrate level in the cultures. Dash lines with small white circles or white squares are growth curves of the cultures indicated by the cell densities of the cultures. Black circles or squares represent APR activities normalized to cellular protein content, whereas white circles or squares represent APR activities based on cells. Each data point was the average of six measurements from four independent cultures.

