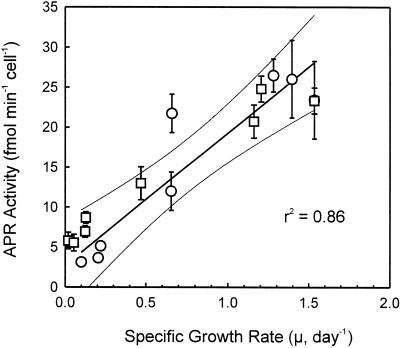
Figure 6.
Correlation of APR activity and specific growth rate (μ). White circles were data points from cultures grown with abundant N supply, whereas white squares were data points from cultures grown with limited N supply. Each data point represents the average of six measurements from four independent cultures.

