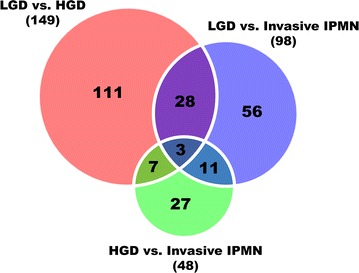
Fig. 7.

Venn diagram of differentially expressed proteins in three comparison groups. By Student’s t test (Benjamini–Hochberg FDR = 0.05), 149, 48, and 98 proteins were differentially expressed between LGD and HGD, between HGD and invasive IPMN, and between LGD and invasive IPMN, respectively. A total 243 proteins were found to be DEPs when overlapping components of the Venn diagram were excluded; 49 proteins were shared in at least two comparison groups and are highlighted in white
