
Fig. 4.
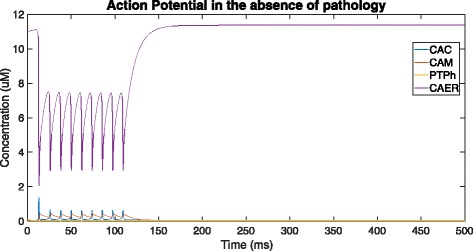
Addition of ER Ca 2+ ion concentration (CAER) to Fig. 3 and a visual representation of the scale of difference between the resting ER Ca 2+ level and cytosolic and mitochondrial resting Ca 2+ levels
Official websites use .gov
A
.gov website belongs to an official
government organization in the United States.
Secure .gov websites use HTTPS
A lock (
) or https:// means you've safely
connected to the .gov website. Share sensitive
information only on official, secure websites.
Addition of ER Ca 2+ ion concentration (CAER) to Fig. 3 and a visual representation of the scale of difference between the resting ER Ca 2+ level and cytosolic and mitochondrial resting Ca 2+ levels