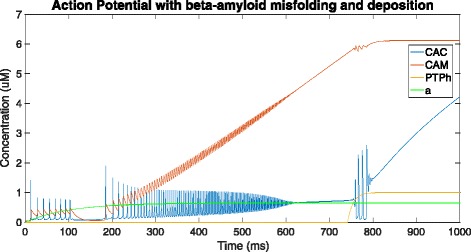
Fig. 5.

Graph depicting cytosolic (CAC) and mitochondrial (CAM) Ca 2+ ion concentration, β-amyloid concentration (a) and tendency for opening of PTP in high-conductance state (PTPh) over a time of 1000ms - in the presence of pathology (using the provided equations, parameter values and initial conditions in the XPP.ode file)
