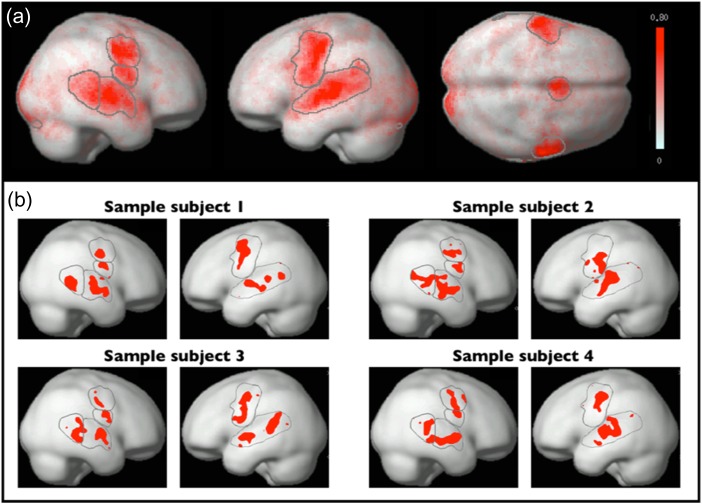
Figure 2.
Articulation-responsive brain regions. (a) A whole-brain probabilistic activation overlap map for 20 participants, with the parcels discovered by the GSS analysis (Fedorenko et al. 2010) overlaid on top (note that 1 of the 11 parcels—L pSTG2—is not visible on the surface; see Fig. 3). (b) fROIs in the left and right hemisphere of 4 sample individual participants. These fROIs were defined by intersecting the individual activation maps for the “hard articulation > fixation” contrast with the parcels, and selecting the top 10% of most responsive voxels within each parcel.

