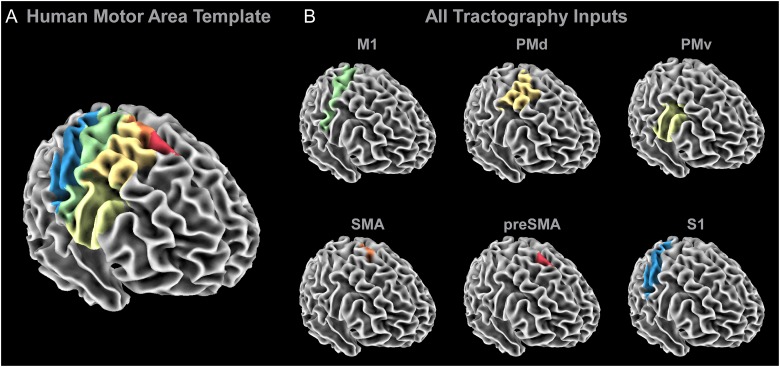
Figure 1.
Probabilistic tractography inputs. (A) The regions within the HMAT were used as seed regions in the probabilistic tractography analyses. (B) A separate probabilistic tractography analysis was conducted for M1 (green), PMd (dark yellow), PMv (light yellow), SMA (orange), preSMA (red), and S1 (blue), in which a planar waypoint was placed at the level of the PLIC (z = 7 to 9) and the CP (z = −31 to −29). Additionally, transcallosal streamlines were excluded by including a planar exclusion mask at the midline (x = −1 to 1).

