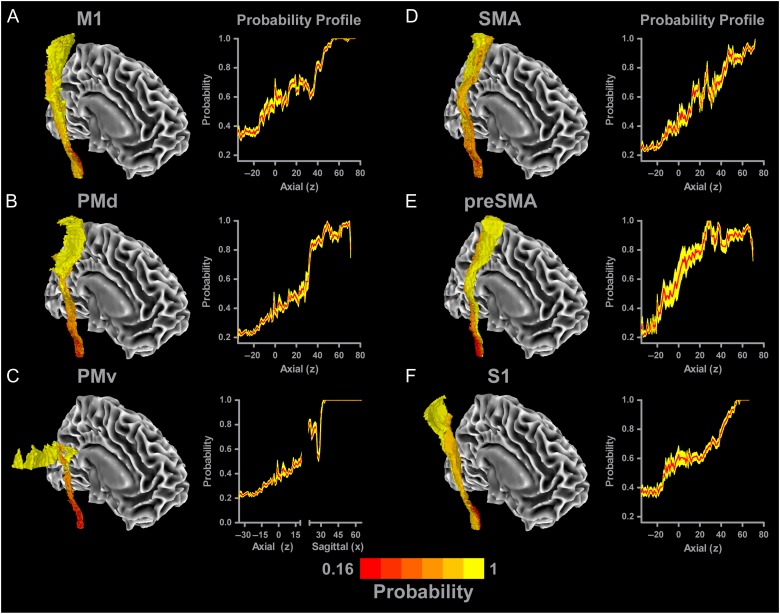
Figure 5.
Probabilistic SMATT. Each tract was overlaid with one another to quantify the amount of overlap between tracts so that a probabilistic value could be calculated for each voxel in the template. The mean probability of each slice is shown with a red line, with the yellow shading representing the mean ± SEM. A view of each tract (A—M1; B—PMd; C—PMv; D—SMA; E—preSMA; F—S1) is shown, in which darker red colors indicate higher overlap with other tracts (i.e., low probability voxel is only part of one tract), whereas brighter yellow colors identify voxels with low overlap with other tracts (i.e., high probability voxel is only part of one tract). Probability profiles are shown for each tract. As the tracts reach more superior regions, the probability of voxels being unique to a particular sensorimotor tract increases.

