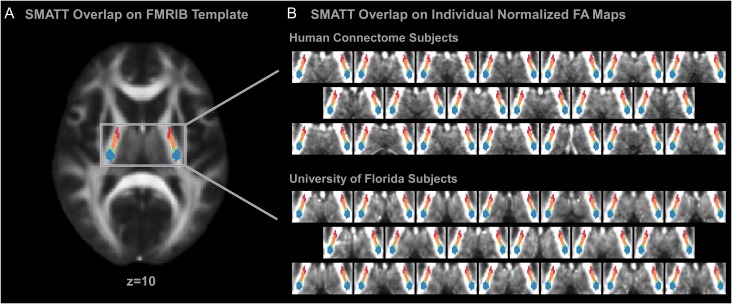
Figure 6.
SMATT overlaid on individual subject data. (A) SMATT overlaid on an axial slice of the FMRIB anatomical template at the level of the PLIC (z = 10). (B) The SMATT overlaid on individual subject anatomical images in standard space. Individual data from 20 subjects collected as part of the Human Connectome Project and individual data from 20 subjects collected at the University of Florida are shown. The SMATT is well aligned in both groups for all tracts. Axial slices are shown at z = 10 which is within the PLIC. M1—green; PMd—dark yellow; PMv—light yellow; SMA—orange; preSMA—red; S1—blue.

