Fig. 2.

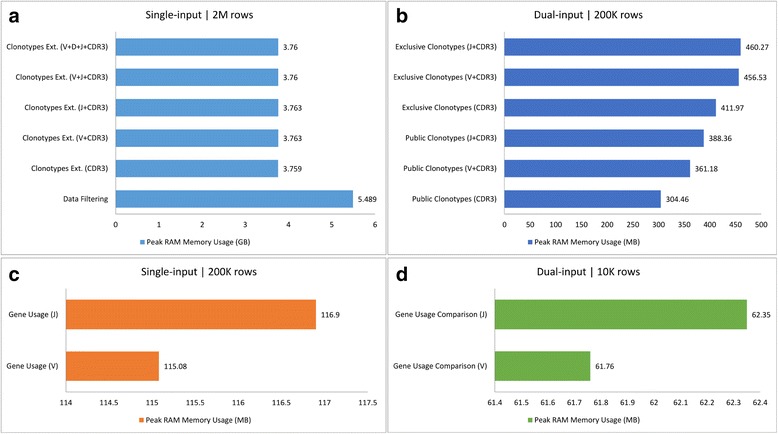
Bar charts of peak RAM memory usage for various groups of tools – tools are grouped on the basis of number of inputs and their size (in number of rows; M = 106, K = 103)

Bar charts of peak RAM memory usage for various groups of tools – tools are grouped on the basis of number of inputs and their size (in number of rows; M = 106, K = 103)