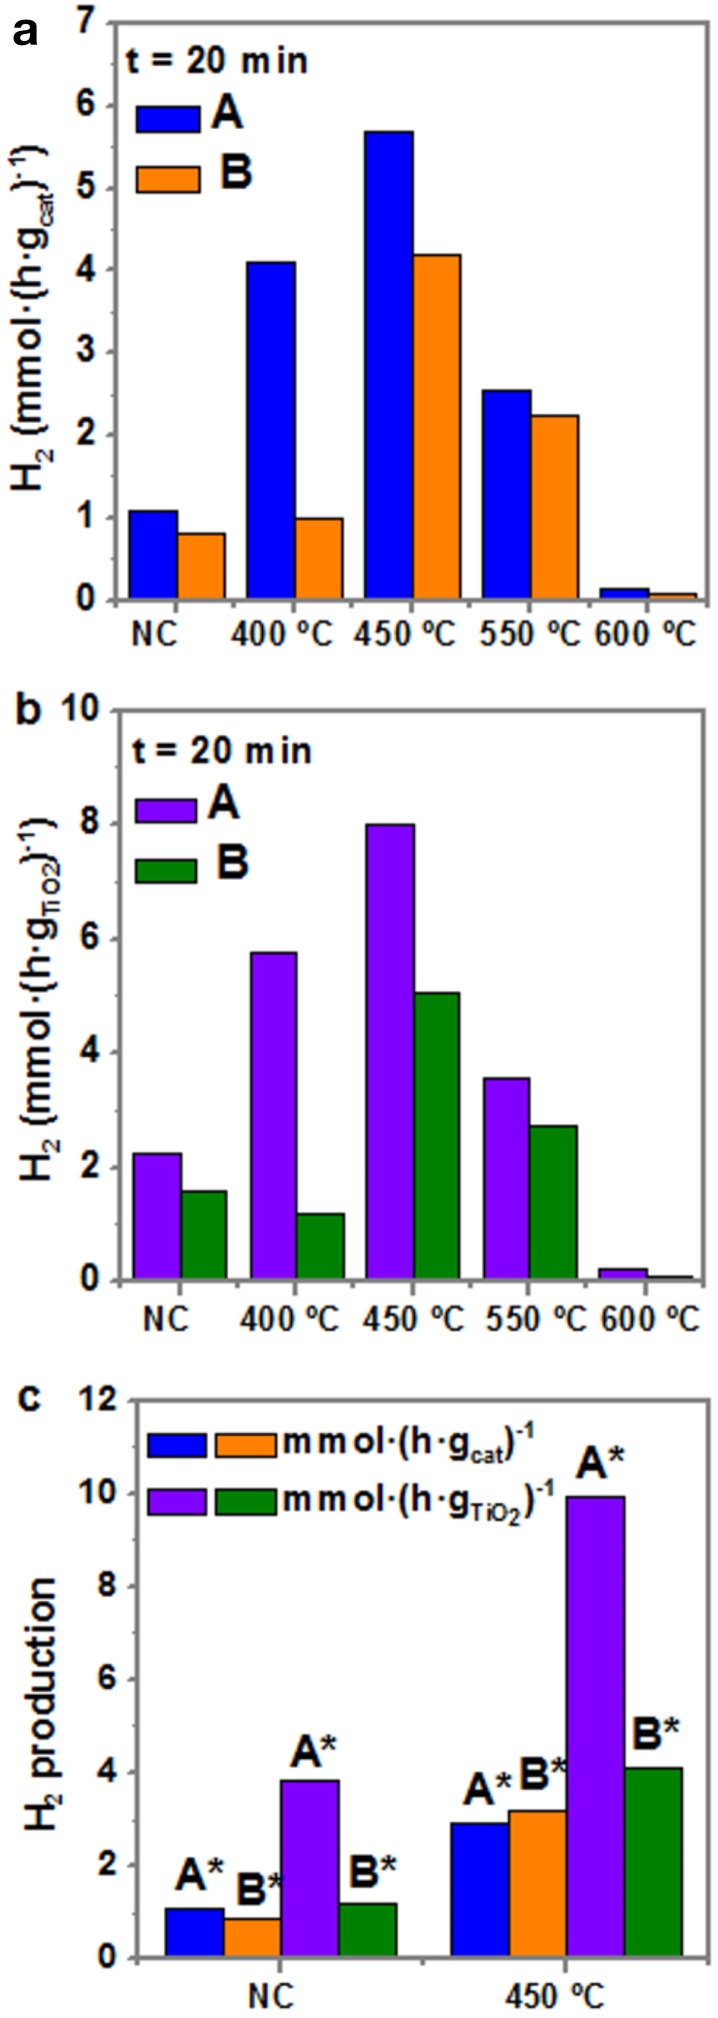
Figure 8.
Hydrogen production rate after 20 min of photocatalytic reaction under UV irradiation of samples A and B at different thermal treatments (a) per mass of catalyst, and (b) per mass of TiO2. (c) Hydrogen production of purified samples after 20 min of reaction, per mass of catalyst and mass of TiO2 NC and at 450°C. Notation: N.C, not calcined; * purified samples.

