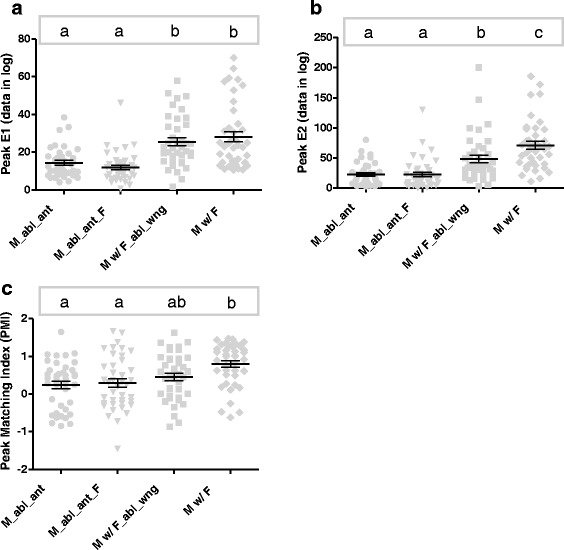
Fig. 7.

Plot of activity values at evening peaks E1 (a) and E2 (b) and plot of the peak matching index (PMI) for each treatment (c), with means and standard errors represented by innermost and outer bars, respectively. Comparison among treatments performed using ANOVA, with Tukey’s post-hoc pairwise tests shown as lowercase letters. Abbreviations: M_abl_ant, males with ablated antennae; M_abl_ant_F, males with ablated antennae with females; M w/ F_abl_wng, males with females with ablated wings; M w/ F, males with females
