Fig. 1.

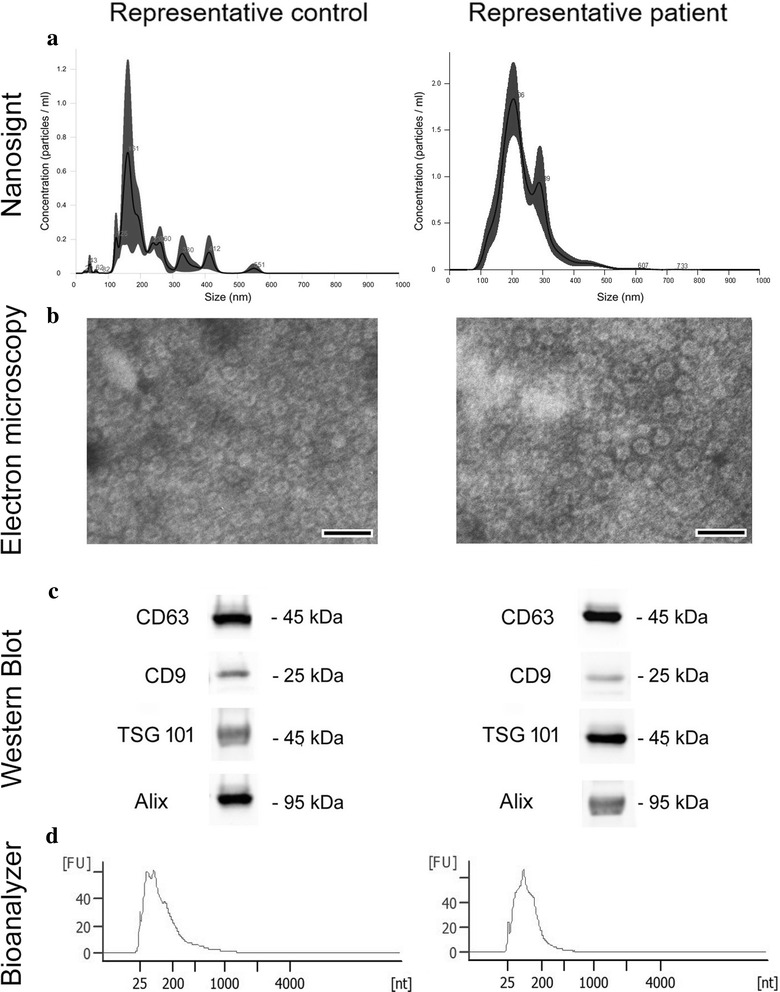
Characterization of salivary EVs. (a) Representative NanoSight image of isolated EVs showing particle size (nm)/concentration (10^8 particles/ml) of a representative control (left) and a representative OSCC patient (right). (b) Representative transmission electron microscopy image of purified EVs negatively stained with NanoVan (JEOL Jem-1010 electron microscope, black line = 200 nm) of a control (left) and a patient (right). (c) Representative western blots confirming the expression of the exosome markers: CD63, CD9, Tsg101, and Alix, on salivary EVs from a control (left) and a OSCC patient (right). (d) Representative profiles of RNA isolated from EVs of a healthy control (left) and a patient (right). The graphs show fluorescence intensity [FU]/nucleotide length [nt] and were obtained through bioanalyzer analysis. Four experiments were performed with similar results
