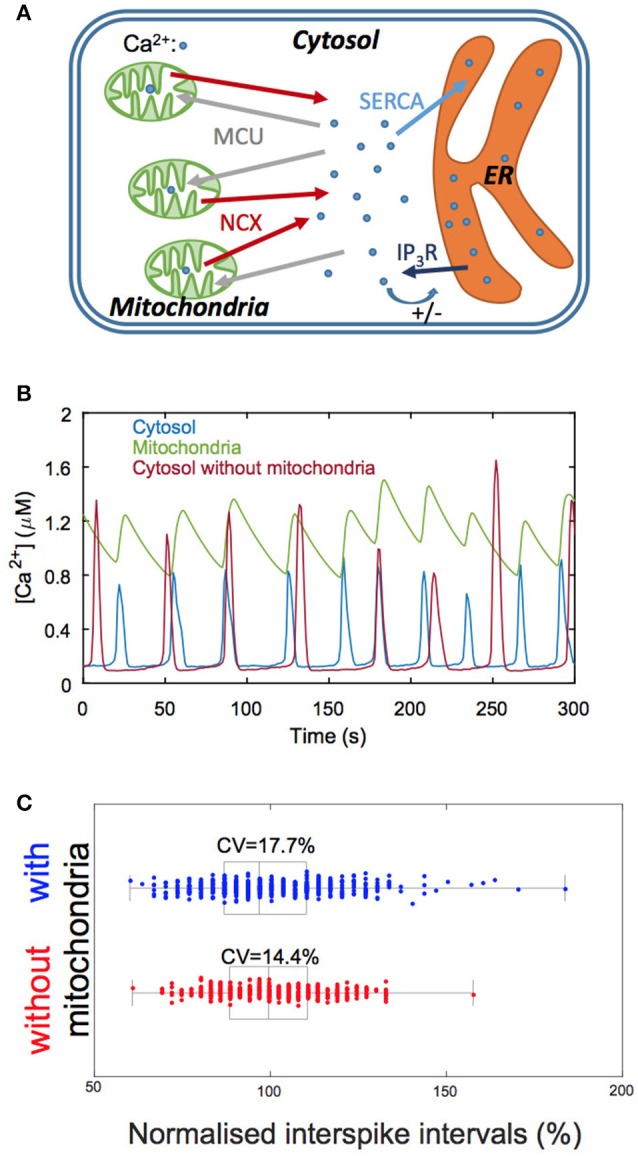
Figure 4.

Involvement of mitochondrial Ca2+ fluxes in simulations of Ca2+ oscillations. (A) Schematic representation of the Ca2+ exchanges processes between the three main cellular Ca2+ compartments: the cytosol, the mitochondria and the endoplasmic reticulum (ER). IP3R: IP3 receptor; MCU: mitochondrial Ca2+ uniporter; NCX: Na+/Ca2+ exchanger; SERCA: sarco- or endoplasmic reticulum Ca2+ ATPase. (B) Numerical simulations of Ca2+ oscillations in a model including mitochondrial Ca2+ fluxes (blue and green traces) and in a model that does not consider this organelle (red trace). Given the small volume of mitochondria, mitochondrial Ca2+ fluxes are quite irregular, which impacts on the variability of the interspike interval. Note, however, that the amplitude of the oscillations is stabilized in the presence of mitochondria. (C) Statistical analysis of the interspike interval when considering (blue) or neglecting (red) mitochondrial Ca2+ fluxes. Boxes indicate the first quartiles of the distributions and bars inside the box, the median values. Interspike intervals are normalized with respect to the corresponding deterministic value. See Wacquier et al. (2016, 2017) for details.
