Figure 5.
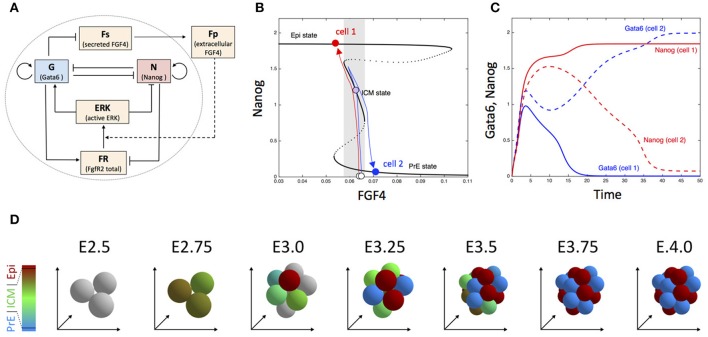
Dynamics of embryonic cell fate determination. (A) Scheme of the gene regulatory network. (B) Bifurcation diagram showing the steady state of Nanog as a function of FGF4. The blue and red arrows depict the trajectory of two cells (for more details, see De Mot et al., 2016). (C) Time evolution of Nanog and Gata6 in the two-cell model. (D) Snapshots showing the simulated the evolution of embryonic cells from the 3 inner cells stage in the 3D model including cell division. Outer cells (trophectoderm) are not considered. Cells are colored according to the proportion of Nanog (red) and Gata6 (blue), with gray indicating blastomers with very low Nanog and Gata6 concentrations. See Tosenberger et al. (2017) for details.

