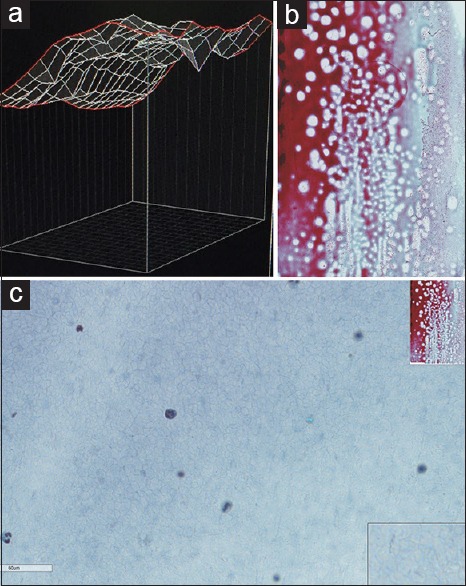
Figure 11.

(a) Ascitic fluid (carcinosarcoma) cell distribution analysis showing the distribution of cells across a wide range of planes in the topography map. (b) Ascitic fluid (carcinosarcoma), Papanicolaou, low power. The whole slide imaging related to the topographical image in Figure 11a. (c) Ascitic fluid (carcinosarcoma), Papanicolaou, high power. High power of the same whole-slide imaging reveals scant cells captured in the acquired z-axis focal planes
