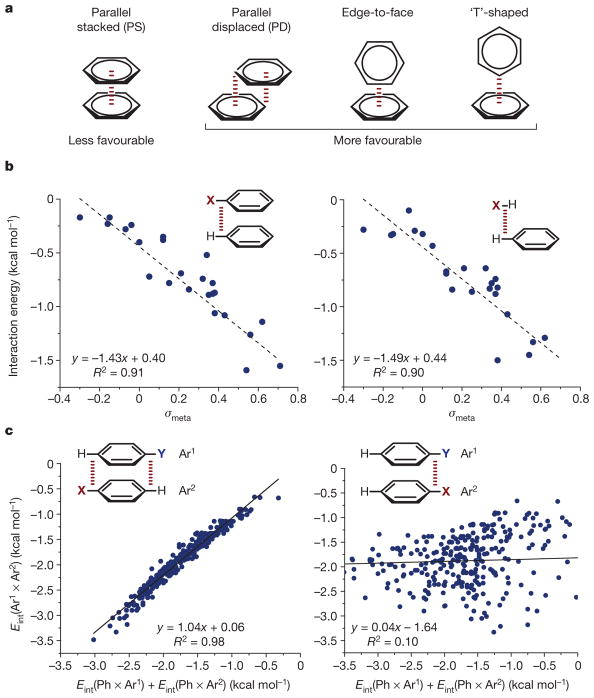
Figure 2. Overview of π-stacking geometries and evidence for the direct interaction model.
a, π–π interaction geometries (see text for details). b, Hammett correlations (interaction energy versus σmeta, the meta-Hammett substituent parameter) supporting the direct interaction model. Broken red line in insets indicates interaction. Adapted from ref. 26, American Chemical Society. c, Correlations demonstrating geometric consequences of the direct interaction model. Insets show Ar1 (top) and Ar2 (bottom); broken red lines in insets indicate interactions. On axes, Eint(Ar1 × Ar2) denotes interaction energy between Ar1 and Ar2, and so on. Adapted from ref. 28, American Chemical Society. In b and c, regression lines and their equations are shown: R, correlation coefficient.

