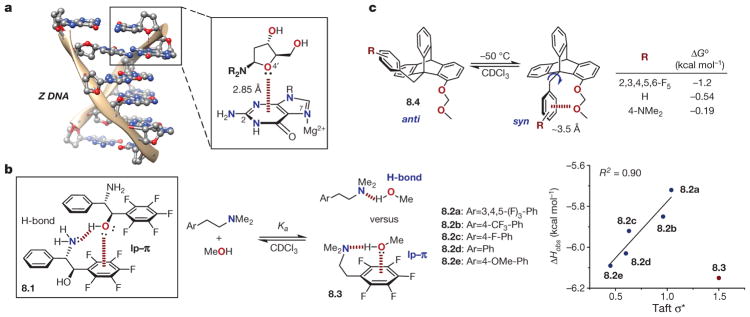
Figure 8. Examples of lone pair–π interactions.
a, Example of lone pair(lp)–π interaction in Z-DNA (broken red line in magnified inset at right). Adapted from ref. 80, PCCP Owner Societies, and refs 90 and 96, American Chemical Society. b, Quantification of lp–π interaction in solution. Box at left, depiction of the dimeric solid-state structure of amino alcohol 8.1 implicating lp–π interactions as important structural elements. Middle, association between electronically diverse dimethylamino arylethylamines (8.2 and 8.3) and methanol in solution, and (right) correlation between enthalpy of association (Δ Hobs) and the Taft parameter (σ* ). c, Quantification of lp–π interactions using molecular torsion balances (anti and syn isomers of 8.4). Δ Go = –RTlnKeq, where Keq = [syn]/[anti].

