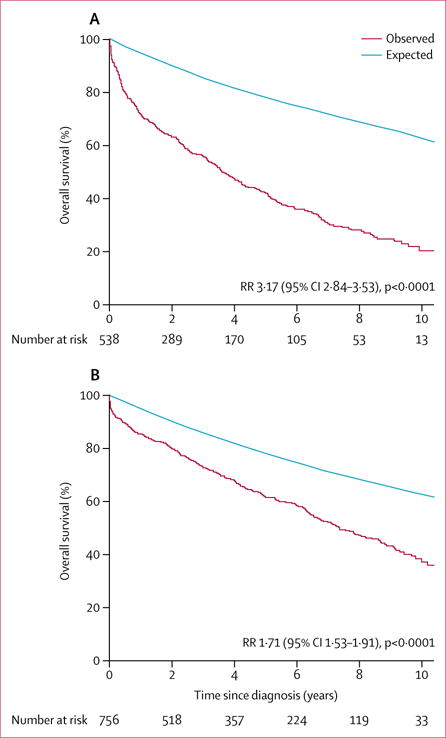
Figure 3. Survival after diagnosis of isolated moderate or severe mitral regurgitation, stratified by left-ventricular ejection fraction at diagnosis.

(A) Survival in residents with left-ventricular ejection fraction <50%. (B) Survival in residents with left-ventricular ejection fraction ≥50%. In each panel, the red Kaplan-Meier curve represents observed survival in Olmsted County residents diagnosed with isolated moderate or severe mitral regurgitation and the blue line represents the expected survival of the general Olmsted County population of same age and sex. RR=risk ratio indicating the excess mortality of patients with mitral regurgitation over the general population of the county.
