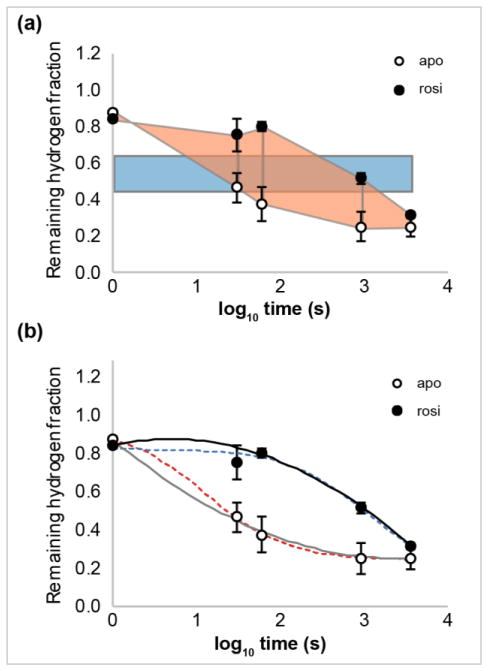
Figure 1.
Exchange curves and methods for estimating Abec, the area between exchange curves. Remaining hydrogen fractions for apo (○) and ligand-bound (●, rosiglitazone (rosi)) states of peptide aa 445–452 of Peroxisome proliferator-activated receptor gamma (PPARγ). HDX data from [10]. (a) Abec values are estimated by the difference of the averaged hydrogen fraction scaled by the span in log time (blue rectangle) or by trapezoidal approximation (peach trapezoids). (b) Time-dependent HDX data can be fitted by weighted second order polynomials (apo, solid grey; rosi, solid black) or logistical functions (apo, dotted red; rosi, dotted blue).

