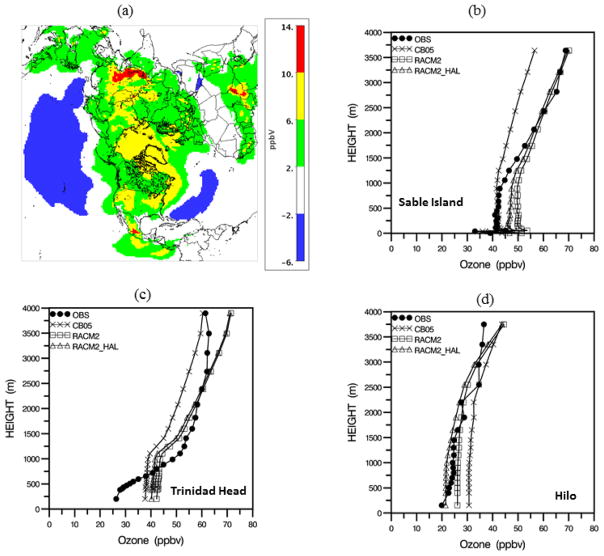
Figure 12.
Differences in simulated O3 distributions using the RACM2 and CB05TU gas-phase chemical mechanisms in the hemispheric CMAQ model. (a) Mean difference (RACM2 minus CB05TU) in monthly mean surface-level O3 (in ppb) for August 2006. Comparisons of mean (for August 2006) O3 mixing ratio vertical profiles simulated with the CB05TU and RACM2 mechanisms with ozonesonde measurements at (b) Sable Island, Nova Scotia, (c) Trinidad Head, California, and (d) Hilo, Hawaii. RACM2_HAL is from a simulation in which the RACM2 mechanism was augmented with halogen chemistry (described in section 2.4.2).

