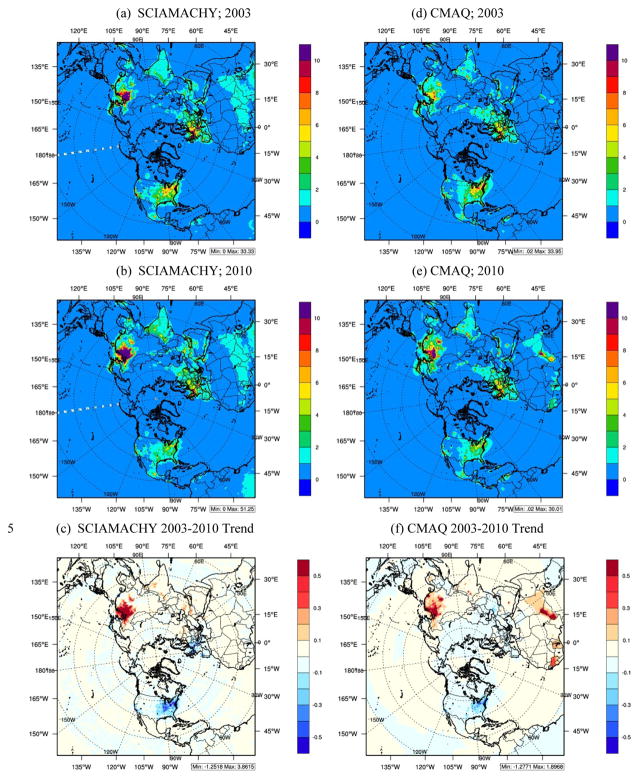
Figure 13.
Comparison of observed (left) and model (right) changes in NO2 vertical column density (VCD) across the northern hemisphere. (a) 2003 SCIAMACHY NO2 VCD; (b) 2010 SCIAMACHY NO2 VCD; (c) SCIAMACHY NO2 VCD trend; (d) 2003 CMAQ NO2 VCD; (e) 2010 CMAQ NO2 VCD; (f) CMAQ NO2 VCD trend. VCD is units of 1015 molecules cm−2, and VCD trend is in units of 1015 molecules cm−2 year−1.

