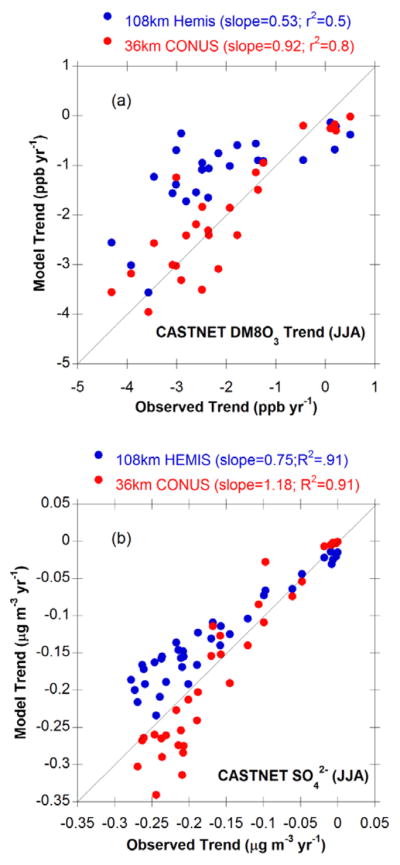
Figure 15.

Comparison model and observed summertime (JJA) 1990–2010 trends at CASTNET monitoring sites in the U.S. for (a) JJA average daily maximum 8-hour average O3, and (b) JJA average SO42−. Model results from the 108 km resolution hemispheric CMAQ simulation are shown in blue, while results from a 36-km resolution nested model calculation over the contiguous U.S. are shown in red.
