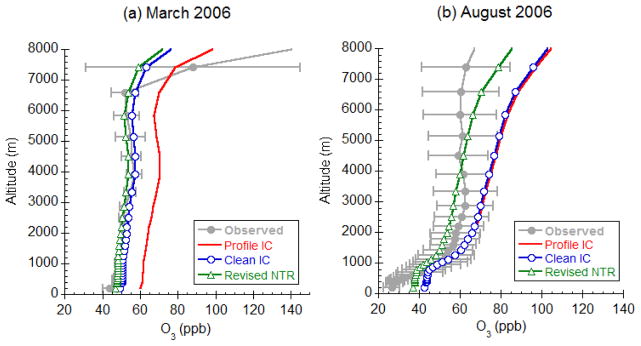
Figure 4.
Comparisons of simulated average vertical profiles of O3 with ozonesonde measurements at Trinidad Head, California, USA: (a) March 2006 (four months after start of simulation), and (b) August 2006 (nine months after start of simulation). Also shown is ±1 standard deviation of the observed mixing ratios. “Profile IC” uses the default profile for initialization as in regional CMAQ applications, “Clean IC” is the case where the model is spun up from clean conditions, and “Revised NTR” is the simulation with “Clean IC” with updates to the physical and chemical sinks for the species NTR representing organic nitrates.

