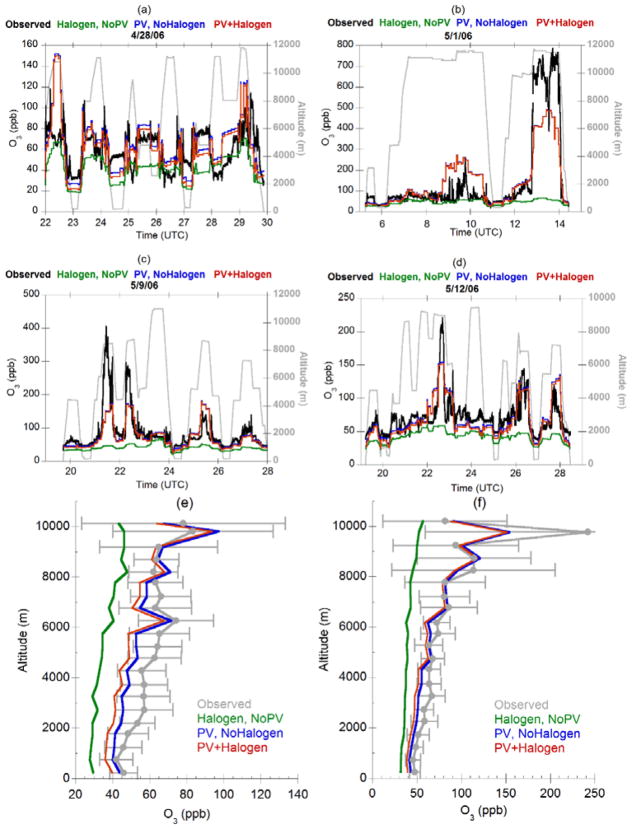
Figure 5.
Comparison of simulated 3-D distributions of O3 mixing ratios with observations from the DC-8 aircraft during the INTEX-B field campaign: (a–d) comparison of observed O3 and simulated values from various model configurations along flight tracks on specific days; (e) comparison of model and observed campaign average O3 vertical profile for flights over the sub-tropical Pacific during 17 April-1 May 2006; (f) comparison of model and observed campaign average O3 vertical profile for flights over the sub-Arctic Pacific during 1–15 May 2006. Also shown in (e) and (f) is ±1 standard deviation for the observed values. Also shown in (a–d) is the aircraft altitude along the flight path.

