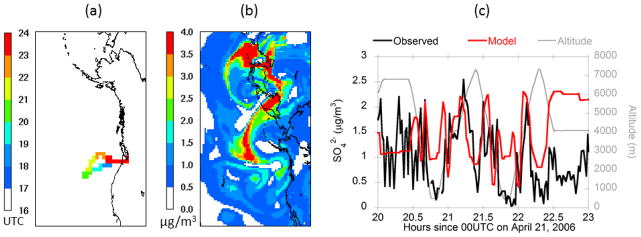
Figure 6.
Simulation of impact of trans-Pacific transport on 3-D distributions of SO42− aerosol on 21 April 2006. (a) Flight path of C-130 aircraft color-coded by hour (UTC). (b) Simulated SO42− distribution at 4 km altitude on 21 April 2006 at 2100 UTC. (c) Comparison of modelled and observed SO42− aerosol concentrations along C-130 flight path.

