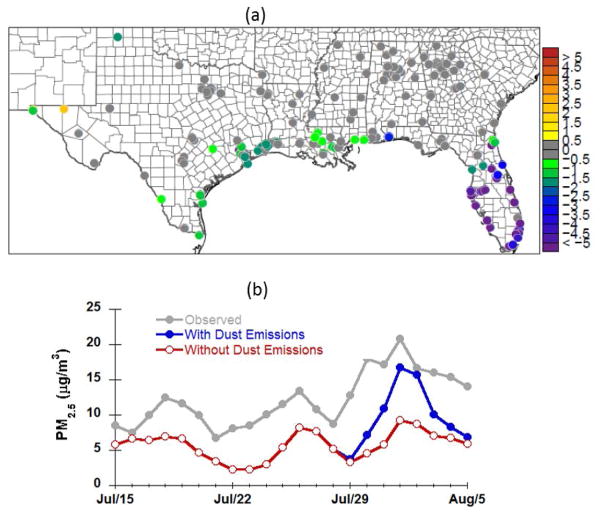
Figure 9.
The impact of simulated trans-Atlantic transport of Saharan dust on daily-average surface PM2.5 in the Gulf region. (a) Average change in bias in daily average surface PM2.5 (in μg m−3) at AQS monitor locations between CMAQ simulations with and without considering dust emissions, 29 July-2 August 2006. Negative changes in bias denote improvement in model performance by including Saharan dust emissions and representing its trans-Atlantic transport. (b) Comparison of modelled and observed daily-average surface PM2.5 averaged over all AQS monitor locations in Florida.

