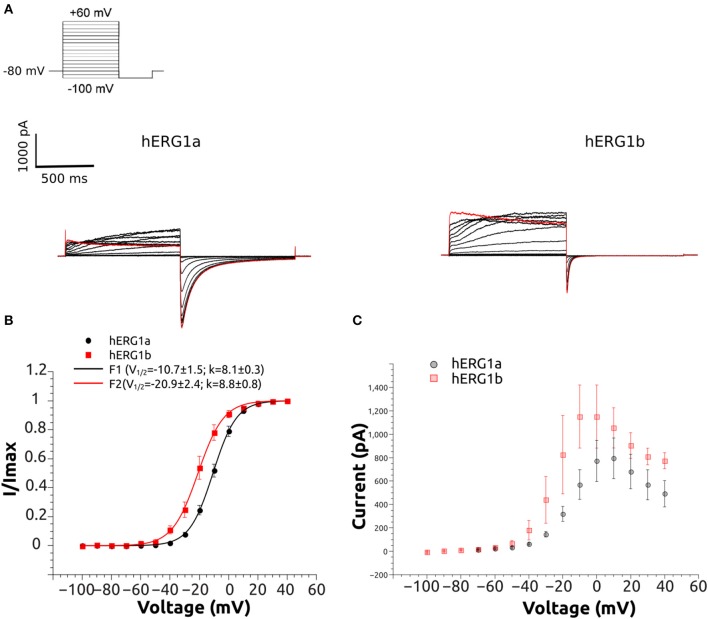
Figure 3.
Representative current traces of hERG1a and hERG1b channels and their current-voltage relationship at room temperature. (A) Selected current traces recorded from HEK cells and elicited by the voltage protocol shown in the top. (B) Normalized tail currents against voltage. The solid lines correspond to the fitted Boltzmann functions and symbols correspond to data. All data are listed as mean ± SEM. hERG1a (n = 10), hERG1b (n = 10). (C) Currents measured at the end of each step were used to construct the current-voltage (I-V) relationship. All data are shown as mean ± SEM. hERG1a (n = 10), hERG1b (n = 10).

