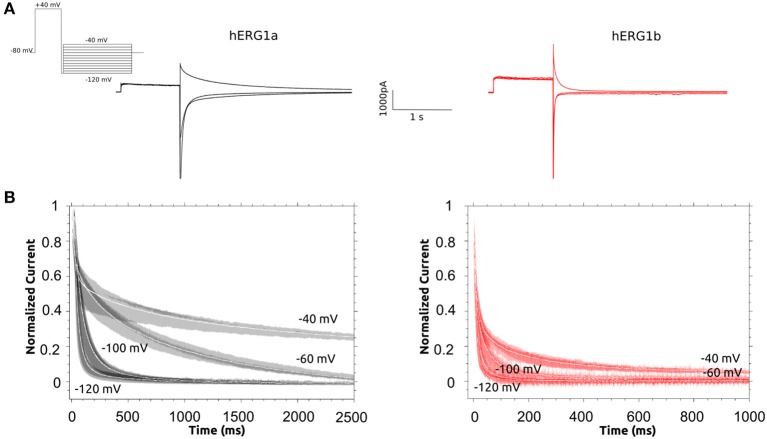
Figure 5.
Deactivation Kinetics of hERG1a and hERG1b channels measured in HEK cells. (A) Representative current traces elicited by the voltage protocol shown in the top for both isoforms. (B) Superimposed raw deactivation time courses for voltages −40, −60, −100, and −120 mV for hERG1a (n = 10) and hERG1b (n = 10). Average time course is shown with a solid white line.

