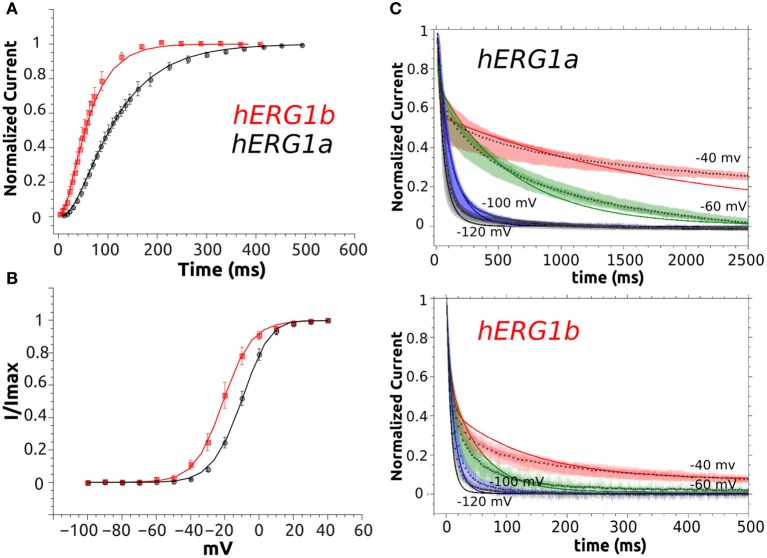
Figure 7.
M-model 2 fit to experimental data. (A) Activation curve of a-isoform and b-isoform. (B) Steady State Activation curve for both isoforms. (C) Simulated deactivation curves at −120, −100, −60, and −40 mV. Simulated data is shown as solid lines and symbols are used for experimental time course data (average, n = 10). Superimposed raw time course data (n = 10) is shown in the background for deactivation at each voltage.

