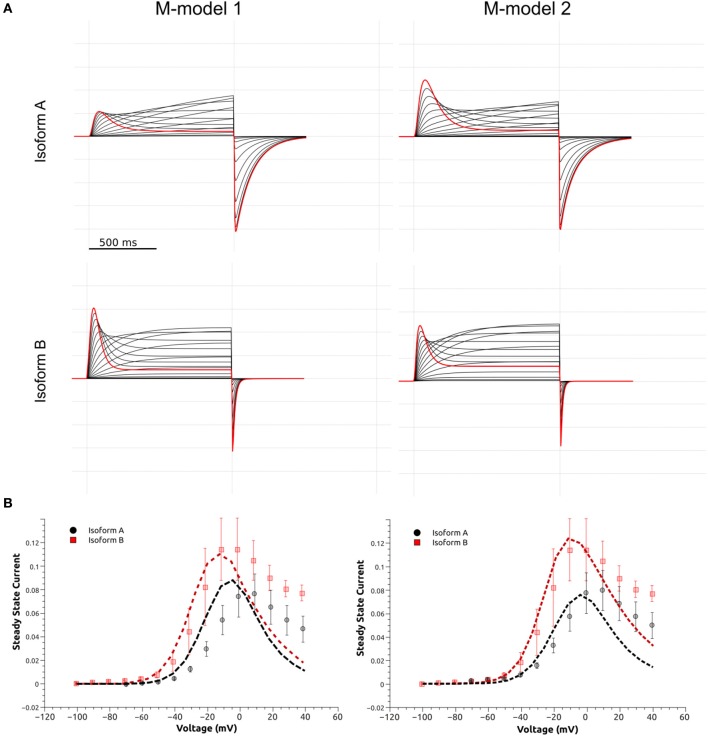
Figure 8.
Simulated currents M-model 1 and M-model 2. (A) Simulated currents elicited by the SSA voltage protocol (Figure 3) for both M-models and Isoforms. (B) Simulated I-V steady state current (x104 pA) relationship for M-model 1 and 2. a-Isoform is shown as black dashed line and b-isoform as red dashed line. Experimental data is shown in the background as symbols with the corresponding error bar (Figure 3).

