Figure 1.

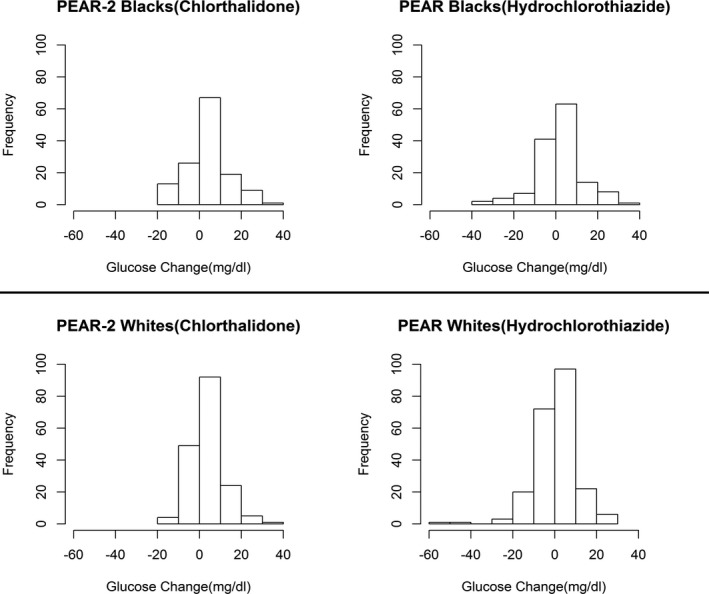
Distribution of glucose change post‐treatment showing the interindividual variability of the response among PEAR‐2 and PEAR participants. PEAR indicates Pharmacogenomic Evaluation of Antihypertensive Response.

Distribution of glucose change post‐treatment showing the interindividual variability of the response among PEAR‐2 and PEAR participants. PEAR indicates Pharmacogenomic Evaluation of Antihypertensive Response.