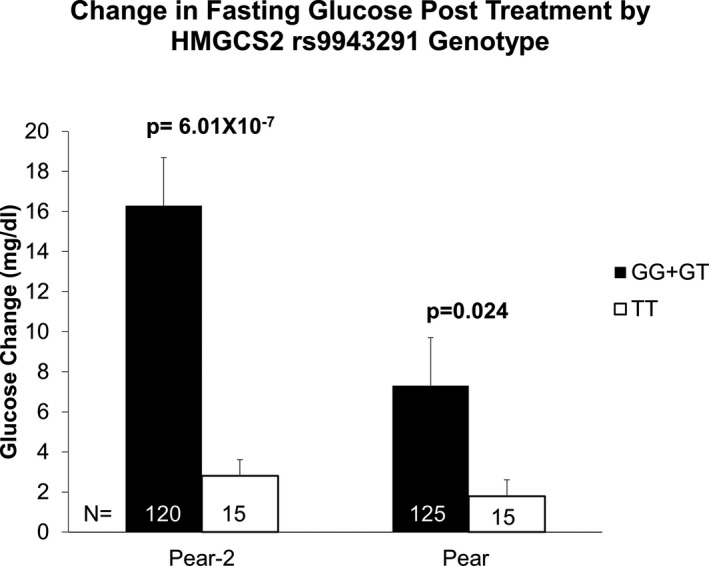
Figure 3.

Glucose change post chlorthalidone treatment among PEAR‐2 blacks (N=135) and PEAR blacks (N=140) post hydrochlorothiazide by HMGCS2 rs9943291 genotype. Glucose change for both studies is adjusted for pretreatment glucose levels, age, sex, and principal components 1 and 2. P values are for contrast of least square adjusted means between genotype groups. PEAR indicates Pharmacogenomic Evaluation of Antihypertensive Response.
