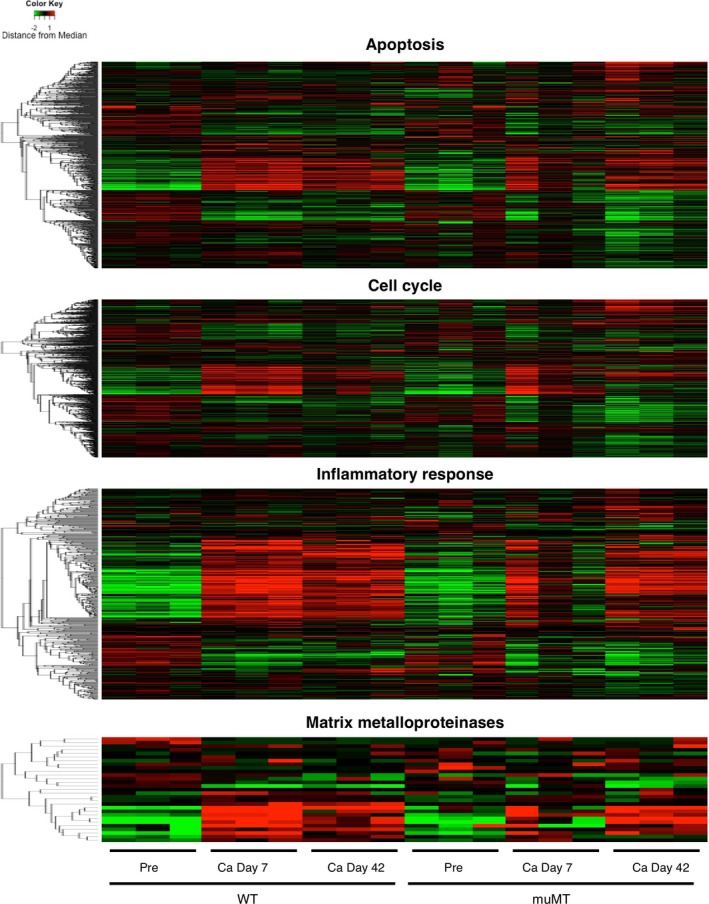
Figure 6.

Gene expression profile in mouse aorta. Results of the hierarchical clustering analysis of the genes with the indicated annotations are shown by heat map. After log conversion of the signal value, the distance from the median is shown in green, black, and red when lower, intermediate, and higher than those of other samples, respectively, within a given gene.
