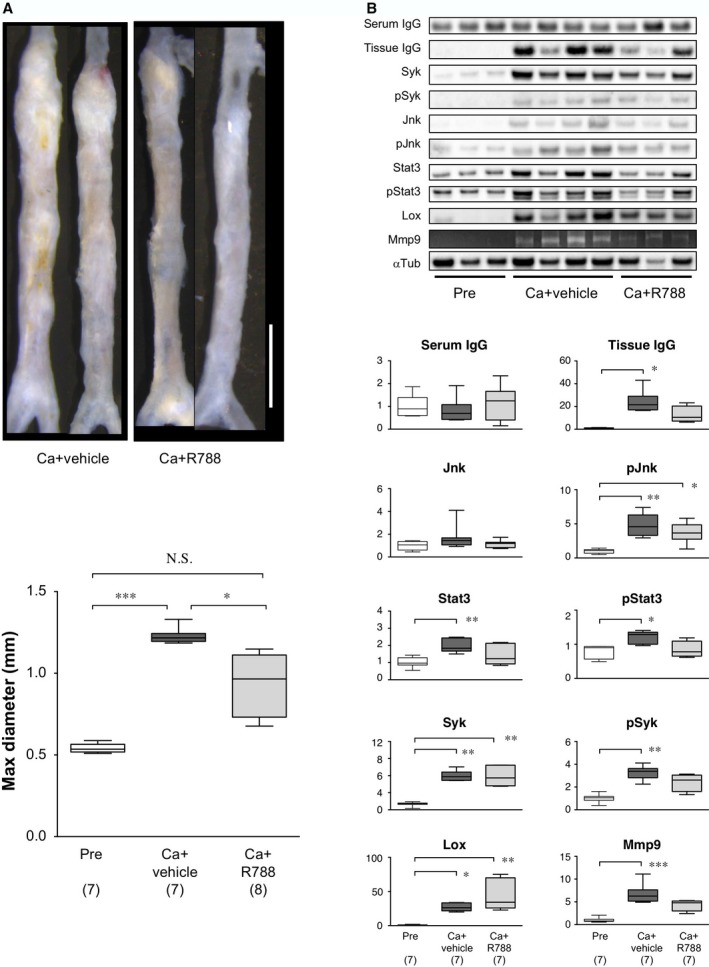
Figure 7.

Effect of Syk inhibitor on murine AAA. A, Upper, Representative images of abdominal aortas, 6 weeks after CaCl2 treatment, without (Ca+vehicle) or with R788 administration (Ca+R788). White bar 2 mm. Lower, Quantitative analysis of maximal diameters of abdominal aortas. Observation numbers are shown in parentheses at the bottom of the box‐and‐whisker plot. B, Upper, Representative images of immunoblots and zymography show protein levels and MMP9 activity, respectively, in samples acquired before (Pre) and 7 days after CaCl2 treatment, without (Ca+vehicle) or with R788 administration (Ca+R788). Lower, Quantitative analyses of the indicated molecules on immunoblots and gelatin zymography (for MMP9). Columns indicate protein expression levels measured before (pre, white columns) or after periaortic application of CaCl2, without (dark gray columns) or with R788 treatment (light gray columns). Observation numbers are shown in parentheses at the bottom of the box‐and‐whisker plots. Values indicate fold expression levels relative to expression measured in Pre samples. *P<0.05, **P<0.01, ***P<0.001. AAA indicates abdominal aortic aneurysm; MMP9, matrix metalloproteinase‐9; N.S., not significant.
