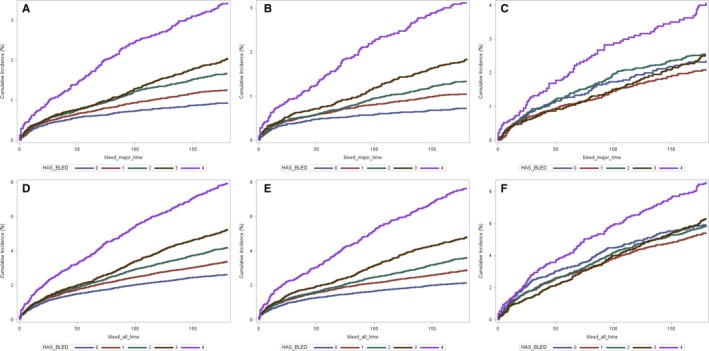
Figure 1.

Cumulative incidence function plots of major (A through C) and all (D through F) bleeding events stratified by HAS‐BLED scores for overall (A and D), non‐cancer (B and E), and cancer groups (C and F). HAS‐BLED indicates Hypertension, Abnormal renal/liver function, Stroke, Bleeding, Labile International Normalized Ratio (INR), Elderly, Drugs or alcohol use. Graph lablel of HAS‐BLED score of “4” indicates HAS‐BLED ≥ 4.
