
Figure 1.
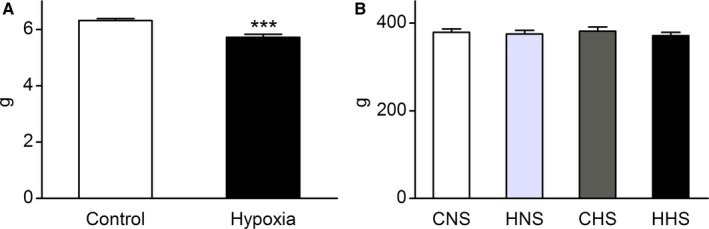
Body weight. A, Birth weight (n=12 per group). B, Body weight of male offspring rats at 12 weeks old. Data are expressed as mean±SEM, ***P<0.001 vs control. CHS indicates control offspring receiving a high‐salt diet; CNS, control offspring receiving a normal‐salt diet; HHS, hypoxia offspring receiving a high‐salt diet; HNS, hypoxia offspring receiving a normal‐salt diet.